Westinghouse (contracted through IMC International) – Pittsburgh, PA 1989–1992
Thermo-Hydraulic Simulation Engineer
Wrote software to simulate fluid systems in real-time BWR and PWR nuclear power plant training simulators implemented in multi-processor distributed architectures.
- Models ranged from single-phase, single component systems to complex, multi-phase, multi-component systems and included interactions with physical control panels, instruments, and surrounding environments.
- Created system to build model constants, interfaces, and documentation from acquired data.
- Built PC-based software simulation framework to develop and test concepts to be implemented on the delivered system.
The Three Mile Island accident led the government to order all commercial nuclear power plants in the U.S. to install full scope operator training simulators. When I worked there I heard rumors that the control room shown in the movie The China Syndrome was actually one of the simulators the company had built but that turned out not to be true. It was built for the movie and some experienced nuclear engineers wrote software that made the gauges and annunciators behave just as they would in the events dramatized. The two simulators I worked on for Westinghouse were WNP Unit 2 in Richland, WA and WEPCo's Point Beach Units 1 and 2 near Green Bay, WI.
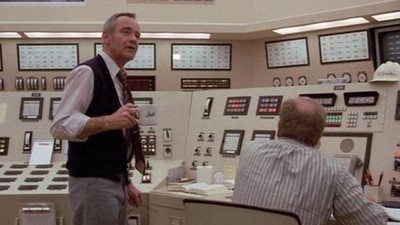
According to one of the bonus tracks on the DVD, this set from "The China Syndrome" (1979, Columbia Pictures, IPC Films) was built especially for the movie.
The simulators were based on duplicates of the actual control rooms in each plant, complete with every panel, light, button, switch, dial, knob, meter, annunciator, plotter, and monitor they had. The setting and action of each control and readout were read and written by handler routines, so the various model routines always had access to variables describing the state of the valves and pumps and so on. The fluid models calculated the pressures, flows, temperatures, and various concentrations of fluids, particulates, and radiation in every plant system and in every operating space within the containment building. Some of the fluid systems were networks of pipes and tanks, while others were rooms, but the principles of modeling each were similar. The important electrical and power systems were also modeled, and the methods and math were pretty similar for those as well.
The flow of fluid between two points is a function of the square root of the pressure drop, the nature of the path through which the fluid is flowing, and the properties of the fluid. Modelers had to conduct detailed research through the thousands of plant documents, manuals, and drawings to determine all of those characteristics so the proper equations and coefficients could be defined for each flow. The equations had to include terms for the state of valves, pumps, and other equipment. Many of the valve positions came from the control panel switch settings while others came from the calculated actions of automatic control valves. Leaks and other failures would be simulated by creating connections between systems that should not normally be connected, say, a junction of pipe with given room. The position of "valves" in these cases were set using remote instructor stations. That way, the instructors could open a leak in a section of pipe and simulated fluid would spill out into a room and affect temperature, level, and radiation sensors that should alert the operators to the problem. These exercises trained the operators how to diagnose and respond to all kinds of dangerous problems in complete safety.
The governing equations were written as differential equations over time (that is, every such equation was written as d-something over d-t equals something else). In some cases the quantities at each point could be written as sums but in other cases the calculations were set up as systems of equations that were solved simultaneously using matrix techniques. The equations had to be linearized, especially those with square root functions, and integrated over time. The fact that the solution matrices were symmetric meant that further numerical methods could be used to cut the running time almost in half. Care was certainly taken to define systems so they required the smallest possible matrices. It turned out that crunching matrices consumed a pretty good proportion of the simulators' CPU cycles.
The system was initialized to the steady state operating condition. Most of the target settings were gathered on a data collection visit to the actual plant where I and other team members recorded the setting and reading of every item on every panel. Initial conditions in every other part of the system had to be determined through research, calculation, and deduction. Once the simulator components were sufficiently constructed and initialized they were exercised by walking the plant through a controlled shut-down and subsequent re-start, ultimately returning the plant to its initial, full-power state. Once that was done all of the error and failure conditions would be tested. The system was capable of recording and restoring snapshots of all state variables, so the entire system could be reinitialized to any state at any time. The contracts stated that the control panel readouts had to be accurate within one percent at steady state and no more than ten percent during transients.
Most of the system software was hosted on Gould/Encore SEL 32/8000-9000 series computers. These were minicomputers with very large circuit boards that had the interesting quality of supporting up to eight processors that shared a common memory space. Handler programs and system models ran on the different processors and shared information via the common memory. The main software routines were all written in FORTRAN with a small helping of assembly language. Instructor stations were hosted on Unix-based Sun workstations, the software for which was written in C for X Windows. The model for the reactor core was sometimes run on a separate Sun workstation as well. Finally, an AYDIN terminal was attached to the system so the engineers could monitor the state of named variables during a simulator run. It was a big, square high-resolution monitor that displayed several columns of variable names and values on the top fiftyish lines, with three or four lines below reserved to issue terminal commands. These could be used to define variables to add to or remove from the display, and to run, step, or freeze the simulator, as well as to stop and start new runs and save and restore system snapshots.
A senior salesman successfully won more simulator contracts than the division could handle, so the higher-ups charged him with managing the division. "You sold 'em, you build 'em!" That led to a massive call for engineers and programmers which I was able to ride for three years. At its peak there were 256 employees on the phone list. The people and friends I met during that time are still part of my life today, particularly some of those who sat in the room to which I was initially assigned. Over the years I got to know most of the other people through golf, softball, and bowling leagues and the many parties the company put on at its recreational facilities.
My first day on the job I was introduced to my supervisor, who handed me a copy of the Modeling Techniques Handbook and informed me that many of the team members were heading to the field for a week and that I should read up and get comfortable. He also gave me the scope documentation for the first model I was supposed to work on. I read up, all right, but I also learned that one of my officemates had a nice variation of a formula for flow of fluid through a pipe. I knew that Crane Technical Paper 410 (also see here) described the pressure drops across industry-standard equipment (bends, valves, etc.), so I ordered one through the Carnegie Mellon bookstore and started writing a utility that let me calculate flows and pressure drops in the piping system of the model I was assigned. The piping system was detailed in the many isometric, process, and control drawings I researched.
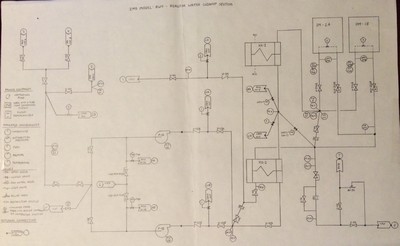
My first assignment was this single-phase, single component fluid model. The arrows show connections to other models.
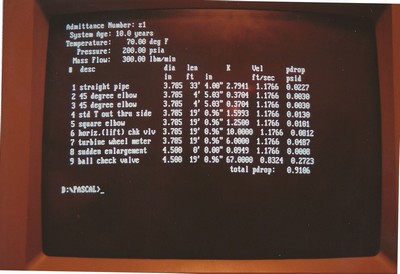
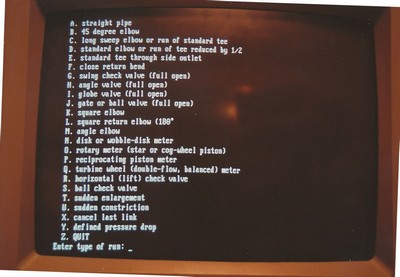
I wrote this program to calculate pressure drops in the pipe runs of the first system I was modeling. It turned out to be more than sufficiently accurate.
The first two or three systems I worked on were assumed to always be filled with liquid water (along with some trace contaminants and radiation that could be modeled logically without affecting the behavior of the fluid) and so could be modeled using a tool developed by a couple of the in-house employees. The tool was called the Interactive Model Builder (IMB) and it constructed effective and efficient models without necessarily giving the users a good idea of how the internal models actually worked. It was a nice program and worked with a text file interface the same way that GEMS did. Modelers could then add extra code as needed to handle special situations.
I was next assigned a system that was assumed to be easy to model. It involved both steam and liquid so the IMB couldn't be used. The simulators the team had worked on previously had only modeled part of this system, so it was thought that a straightforward approach that only considered the steam and liquid would be sufficiently accurate. Any non-condensable gases were assumed to be such a small part of the system flow that treating the fluid as all steam was sufficiently accurate. However, the model for this simulator needed to include details of the entire system, the back section of which was mostly filled with non-condensable gases that behaved very differently than steam. Therefore I had to come up with a modeling methodology that considered the energy content, partial pressure, and density of all of the components of the flow as it changed from almost pure, high-pressure steam at the start to almost pure air at the exhaust. There were many different physical effects embodied in the system, including vessels which catalytically recombined the hydrogen and oxygen dissociated in the reactor core, various filters that separated and absorbed moisture and particulates in different ways, in-line buffer pipes and vessels that allowed significant radiation decay, heat exchangers, chillers, and so on.
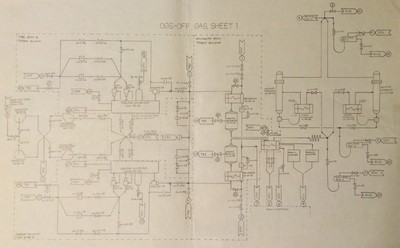
After working on one or two more simple systems I was assigned this multi-phase, multi-component model. This is sheet 1 of 3 the way I redrew it for my own use. Everyone thought it could be modeled in a simple way but it turned out to require a far more complex approach. I got an education and a half with this thing.
Doing the research for the model took plenty of time but that was nothing compared to what it took to write up the modeling documents. These documents described the background, constants, and equations for each model, and they were beautiful and educational to write. The modelers would write up the basic information and a team of editors would proofread it before the whole thing was formally created in FrameMaker. That wouldn't have been so bad but I ended up rewriting that document several times. Sometimes it was because someone wouldn't like the way I named my nodes (yes, really), other times it was because the variables weren't described the correct way. The consultant brought in to oversee that work was quite a character and caused no shortage of frustration for me and my colleagues. He probably cost the project over a million dollars in duplicated and wasted effort, but he was an interesting person who could be lots of fun to talk to. The main problem was that too much emphasis was placed on making pretty documents before anyone knew whether the code was going to work. A set of governing equations was only the beginning of the problem. A model could be coded any number of ways and I experimented with a bunch of them. I think too little attention was paid to that as an organization. When the Agile Manifesto was created to include the line, "Working software (is valued) over comprehensive documentation", you can bet I think back to these events.
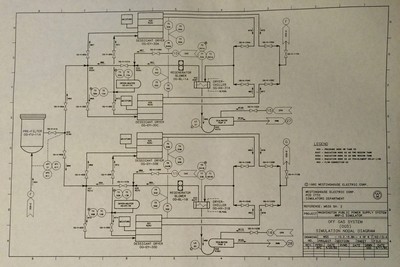
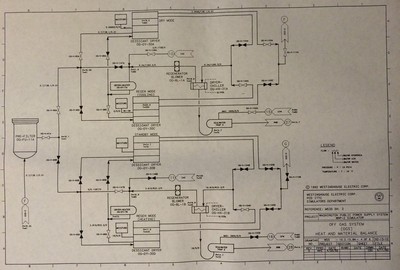
These drawings both represent sheet 4 of 6 in the documentation. One is the Simulation Nodal Diagram and the other is a Heat and Material Balance.
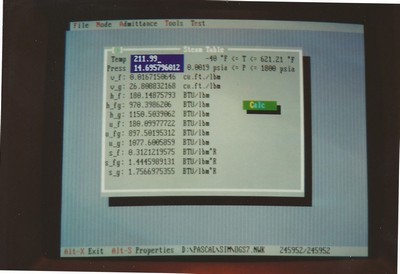
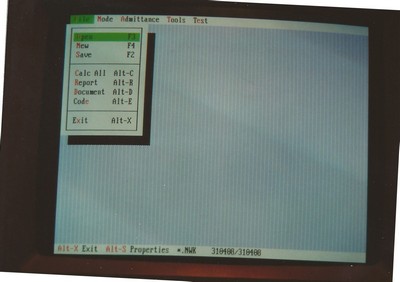
Getting time on the simulator itself was very difficult so I eventually found myself having to create a simulation framework I could use to test my code on a PC. The UI for the first iteration of the program mimicked the AYDIN terminals we used on the simulator. The whole thing was built on object-oriented principles that I'd read about beginning with Turbo Pascal version 5.5. In order to run such a model on my PC I had to write my own functions to calculate the thermodynamic properties of steam. Writing functions for the saturated properties was pretty straightforward; I generated functions using a curve-fitting program I wrote based on techniques I'd seen in a paper industry magazine. Writing functions that worked for superheated steam was more difficult but I got something together that worked well enough to support my independent testing. During those years I worked with the steam tables so much that I started to memorize sections of them.
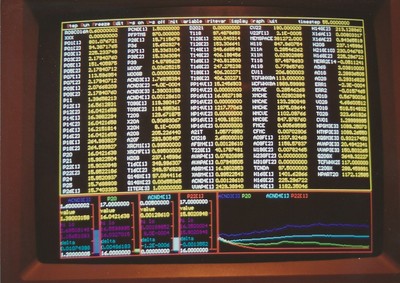
This is the model testbed I wrote on my PC. It allowed me to review the model's progress by updating the values of the variables I needed to monitor. I added some real-time scrolling and level graphs for good measure. The top row showed the relevant commands, states, and model time.
I spent so much time writing and rewriting the model document that I found it necessary to write a PC program to try to automate that process, too. Turbo Pascal version 6 included an object-oriented, text-based, mouse-driven windowing system called Turbo Vision, so I leveraged these capabilities to write the desired utility. It allowed me to enter all of the information about every node and connection in the model, as well as the various physical parameters and references from my research. Once the data was entered it would calculate all of the necessary model coefficients and format them as a table. It would also print out all of the governing equations, complete with introductions, subheadings, nicely formatted formulas, equation numbers, and lists of what all of the variables represented and what data type they were. The program would allow me to incorporate text snippets I created by hand to describe the equations that couldn't be handled in an automated fashion. I then had to print that monster out and send it to the editing team, who had to re-enter the entire thing by hand. Every. Time.
I had leveraged an article in an industry magazine at my previous job to generate functions to calculate thermodynamic properties of steam. I used the functions I generated in my own desktop simulations and also wrote a TSR (Terminate-and-Stay-Resident) program that could be summoned any time in DOS, the same way Borland's Sidekick program made a few useful services available.
Turbo Pascal 5.5 yielded to Borland Pascal versions 6 and 7, which introduced a text-based object-oriented UI called Turbo Vision.
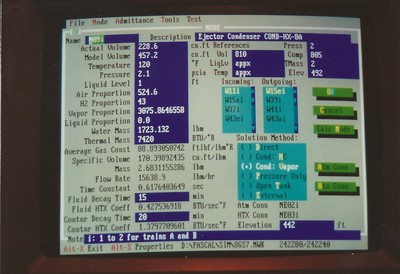
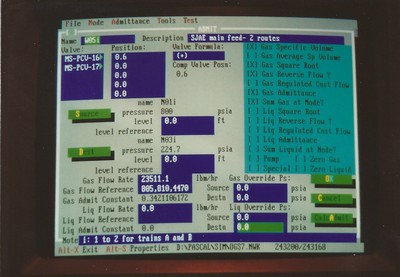
In the course of re-working the model over and over again I found it necessary to automate the creation of the voluminous documentation by writing this program. It allowed me to enter all the data about the nodes and connections within the system, including the references to the sources of all values, and use that information to generate the two hundred-plus pages of repetitive documentation and a table of all the constant coefficients that were to be used in the many equations. I started to expand the system so it would write out the necessary code in both FORTRAN and Pascal, but there wasn't time to complete that work before the contract ended.
Once the bulk of work was complete the division began reassigning Westinghouse employees and terminating the contractors. I turned over my models and others I had taken over to senior Westinghouse employees who were staying on, and was especially pleased when the engineer who took over my most complicated model wrote that there were a handful of minor details that needed to be fixed but that the overall solution methodology appeared to be sound. I heard later that the team who finally delivered the simulator and worked through the final acceptance process finally came to understand just how difficult the model was to get to work.
I made way more as a contractor than many similarly experienced colleagues, but of course the price for that was to go away when the contract was done. Some of my more experienced friends who were contractors were able to secure positions for a year or two at simulators at other plant sites while others went elsewhere. Three of my friends went off to law school or medical school. I just wanted to keep being an engineer.
I actually did find a position with S3 Technologies, which was one of the other two major builders of these simulators (the other being CAE in Canada). I trained for a week at their headquarters in Columbia, Maryland and then drove down to the Bellefonte Nuclear Power Plant outside of Huntsville, Alabama. I reported to the simulator building at 8:30 in the morning as instructed, only to have the manager there ask me, "Why are you here? The contract was canceled. Didn't they tell you? Go home!" I and several others in the same boat hung around for three days while people mulled it over, and we did end up returning home. S3, despite the confusion, was pretty gracious about the whole thing.
My contracting company eventually found a consulting job for which I was uniquely suited and when that was done I signed on at a different company that had contracted some of my other ex-Westinghouse colleagues.

