A Simulationist's Framework
for Business Analysis
Part 09:
How to Unsnarl a Problem
When You're Dropped In the Middle of It
R.P. Churchill
CBAP, IIBA-CBDA, PMP, CSPO, CSMLean Six Sigma Black Belt
www.rpchurchill.com/presentations/BAseries/09_Unsnarl www.rpchurchill.com | Portfolio | Presentations

Moschitta-Hawking Scale


|
30 Years of Simulation
Continuous simulation of the heating of a square billet and Discrete-Event simulation of a multi-phase process.
30 Years of Simulation
|
Industries
|
|
|
Structure of the BABOK
Chapter 1: Introduction (structure of the BABOK)
Chapter 2: Key Concepts (basic context of business analysis)
Chapters 3-8: Knowledge Areas (the basic flow of what gets done)
Chapter 9: Underlying Competencies (Analysis, Behavior, Domain Knowledge, Communication, Interaction, Tools/Tech)
Chapter 10: Techniques (50)
Chapter 11: Perspectives (Agile, BI, IT, Business Architecture, Process Management)
Appendices
The Framework:
- Project Planning
- Intended Use
- Assumptions, Capabilities, and Risks and Impacts
- Conceptual Model (As-Is State)
- Data Sources, Collection, and Conditioning
- Requirements (To-Be State: Abstract)
- Functional (What it Does)
- Non-Functional (What it Is, plus Maintenance and Governance)
- Design (To-Be State: Detailed)
- Implementation
- Test
- Operation, Usability, and Outputs (Verification)
- Outputs and Fitness for Purpose(Validation)
- Acceptance (Accreditation)
- Project Close
BABOK Knowledge Areas vs. Bob's Framework
| Bob's Technique | Business Analysis Planning and Monitoring | Elicitation and Collaboration | Requirements Life Cycle Management | Strategy Analysis | Requirements Analysis and Design Definition | Solution Evaluation | Requirements per BABOK |
| Project Planning | X | x | |||||
| Intended Use | x | X | x | x | x | Business Requirements | |
| Assumptions, Capabilities, Limitations, and Risks & Impacts | x | X | x | ||||
| Conceptual Model (As-Is State) |
x | X | X | ||||
| Data Sources, Collection, and Conditioning | x | X | |||||
| Requirements (To-Be State: Abstract) |
x | X | X | x | X | Stakeholder Requirements | |
| Design (To-Be State: Concrete) |
x | x | X | X | Solution Requirements (Functional and Non-Functional) |
||
| Implementation | x | X | x | X | x | x | Transition Requirements |
| Test Operation and Usability (Verification) |
x | X | |||||
| Test Outputs (Validation) |
x | x | X | ||||
| Acceptance (Accreditation) |
x | X | |||||
| Project Close | X | x |
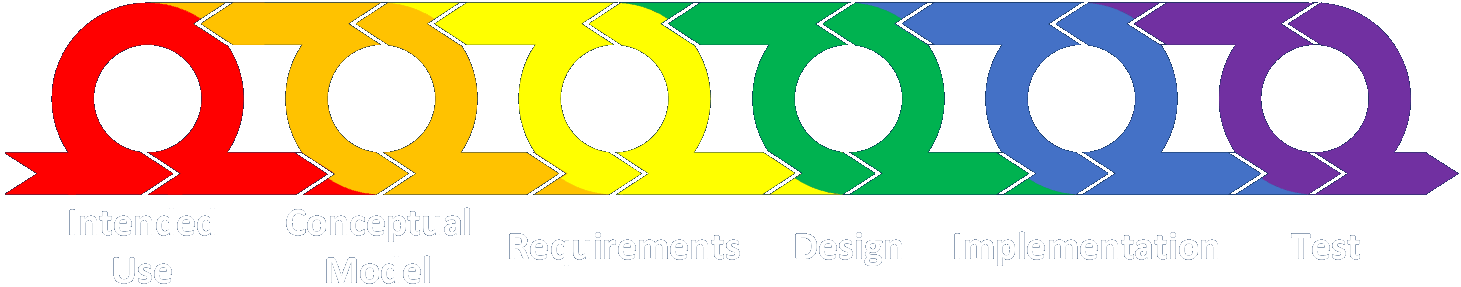
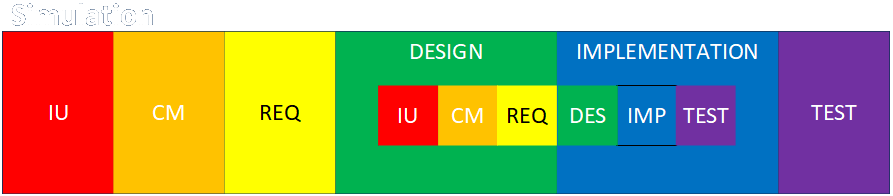
The Framework: Simplified
 Intended Use
 Conceptual Model (As-Is State)
 Data Sources, Collection, and Conditioning
 Requirements (To-Be State: Abstract)
- Functional (What it Does)
- Non-Functional (What it Is, plus Maintenance and Governance)
 Design (To-Be State: Detailed)
 Implementation
 Test
Test- Operation, Usability, and Outputs (Verification)
- Outputs and Fitness for Purpose (Validation)
Intended Use
This defines the customer's goals for what the new or modified process or system will accomplish.
It may describe technical and performance outcomes but must ultimately be expressed in terms of business value.
Each goal can be described in terms of:
- Key Questions - questions to be answered
- Application - decisions to be made
- Outputs and Data - specific outputs to be generated
This information is included in the Project Charter from the PMBOK.
Assumptions, Capabilities, and Risks & Impacts
Define the scope of the project and what capabilities and considerations will and will not be included.
Describe the risks inherent in the effort and the possible impacts of risk items occurring.
Reasons to omit features and capabilities:
- Outside of natural or organizational boundaries
- Insufficient data or understanding
- Impact on results is small (benefit not worth cost)
- Components aren't active in modes being investigated
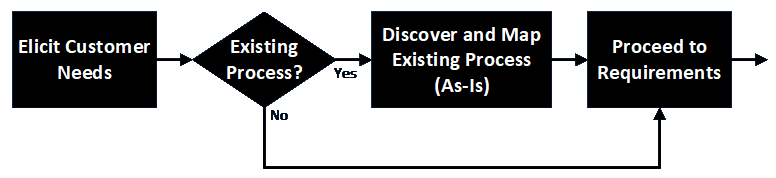
Conceptual Model (As Is State)
If an existing process is to be modified, improved, or automated, discover all operations and data items. This defines the As Is State. (In simulation this is known as building a Conceptual Model.)
If there is not an existing process, work backwards from the desired outcomes to determine what operations and data are required.
Map out the discovered process and document and collect data and parameters for each operation and communication.
The conceptual model is not a specific type of drawing, but is a representation of an existing system using any appropriate techniques.
Iteratively review the maps, data, and descriptions with customers and SMEs until all parties agree that understanding is accurate and complete!
Data Sources, Collection, and Conditioning
Refers to input items (nouns) processed, not parameters (adjectives) that describe the operation and characteristics of the system.
Map sources, sinks, and messages to Conceptual Model.
Data sources (or assumptions) must be found that support the generation of all required output data items. Trace backwards from desired outputs to required inputs and calculations.
Items must be validated for accuracy, authority, and obtainability.
Interfaces should be abstract initially (e.g., with management and through initial discovery and scoping), and then detailed in design and implementation with proper SMEs.
Ensure that data and flags, states, formats, and metadata are captured in sufficient detail. Work with implementation SMEs as needed.
Link to detailed discussion
Requirements (To-Be State: Abstract)
Functional
- What the system DOES
- Describes components, behaviors, entities, actions, inputs, and outputs.
- Contains the details of the design the user sees and the mechanisms that generate results.
Non-Functional
- What the system IS
- Describes qualities (in terms of "-ilities," e.g., reliability, modularity, flexibility, robustness, maintainability, scalability, usability, and so on).
- Describes how the system is maintained and governed.
- Describes how the system is hosted.
The requirements include the criteria by which functional and non-functional elements will be judged to be acceptable.
This represents the To-Be State in abstract terms.
All items in the requirements should map to items in the Conceptual Model in both directions. This mapping is contained in the Requirements Traceability Matrix (RTM), which can be implemented in many ways.
Design (To-Be State: Concrete)
The design of the system is a description of how the system will be implemented and what resources will be required.
The design of the system also includes plans for maintenance and governance going forward.
All elements of the design must map in both directions to all elements of the Conceptual Model and Requirements via the Requirements Traceability Matrix (RTM).
BAs may or may not participate in the design of the system directly, but must absolutely ensure that all elements are mapped to previous (and subsequent) elements via the RTM.
Implementation
This phase is where the implementation is actually carried out, based on the design.
Implementation also means deployment.
Alternatively, deployment and delivery, and even handover, could be considered to be a new phase after testing.
Test
Operation and Usability (Verification)
- Tests to ensure the system operates as intended.
- This process ensures that the system:
- makes sense to the users
- enables manipulation of all relevant elements
- prevents and corrects errors
- maintains users' situational awareness
- includes documentation, training, and help
- These types of tests are most able to be automated.
Outputs (Validation)
- Tests to confirm the accuracy of the results produced.
- Ensure simulation behavior matches real-world system for known cases
- Validation of results may be:
- Objective, e.g., measured comparisons to known values in a simulation or calculation
- Subjective, e.g., judged as "correct" by SMEs for novel situations and realizations of business value
- The outputs are what provide the business value of the solution.
Additional information about Verification and Validation here.
Test (continued)
All elements of the test plan and results must map in both directions to all previous elements in the Requirements Traceability Matrix (RTM).
Specialized test SMEs may conduct the majority of system testing, but implementors, managers, customers, maintainers, and end users should all be involved.
Provisions for testing, V&V, and quality should be built into the process from the beginning.
Link to detailed discussion.
Acceptance (Accreditation)
This phase ensures that the customer's plans and criteria for acceptance are met. All of the stated acceptability criteria must be addressed.
This plan must include the process for handing the system or process over to the customer (internal or external). This process may include documentation, training, hardware, software, backups, licenses, and more.
The customer is the final judge of acceptance and may make three judgments:
- Full Acceptance
- Partial Acceptance with Limitations
- Non-Acceptance
Communication Models
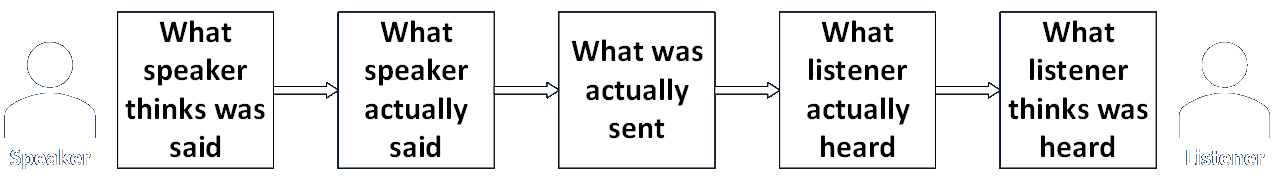
There are multiple barriers to clear communication.
These can be mitigated by error-checking mechanisms — and by being clear in the first place.
The end blocks can be improved by review, mutual expertise, patience, and empathy.
The middle blocks can be improved by clearing up the communication medium.
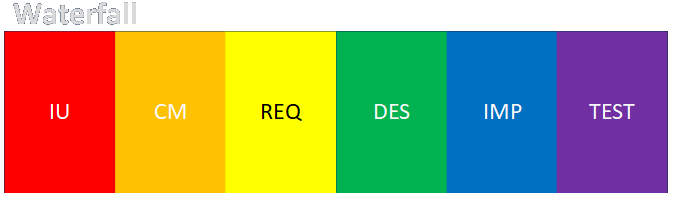
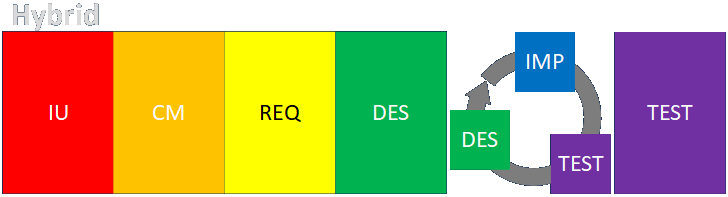
Customer Feedback Cycle
Agile is Dead (in a rigorously formal sense)
Requirements Traceability Matrix
- Best represented by a relational data structure but any method will work.
- Needs discovered later could require the creation of earlier elements.
- Methodological requirements (at bottom) can each be thought of as a kind of non-functional requirement that doesn't need to be mapped.
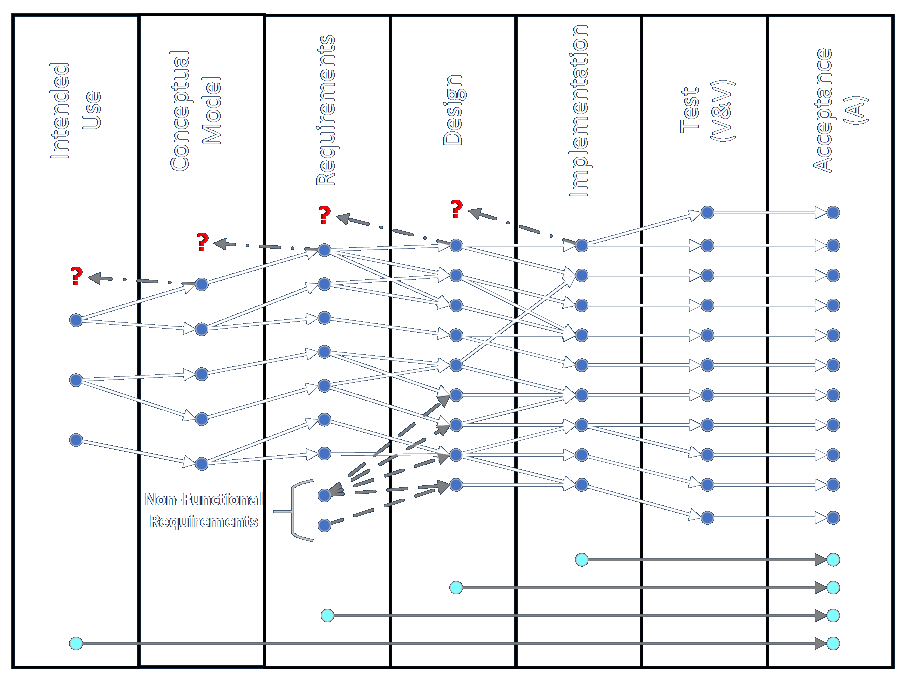
Link to detailed discussion.
Engagement vs. System vs. Solution
The engagement is what we do to effect a change that serves customers.
The system is what we analyze and either build or change to serve customers.
The solution is the change we make to serve customers.
Framework Summary
All of these things happen - even if any individual doesn't see them.
The more everyone understands about the process and how they fit into it, the better off the whole organization will be.
If this is done properly, the problems (like UI/UX) practically solve themselves in some cases. (See Solving the Problem Abstractly.)
Specific expertise is always valuable, but you can't realize its greatest benefits if the basic process and understanding are disorganized.
Why do so many business analysis activities look so different?
- If you talk to different BAs they often seem to be doing very different things.
- Job ads seem to vary quite a lot.
- I've surveyed five groups of BAs now. They report a lot of things in common, but a lot of things that are different, too.
Different Teaming Concepts
- Temperament (from Communicating with Leaders):
Coach (Heart), Facilitator, Executor (Hands), Driver, Visionary (Head), Champion
Participants see to aspects of the engagement.
- SDLC Cross-Functional Areas (discussion here):
Business Value, User Experience, Process Performance, Development Process, System Value, System Integrity, Implementation, Application Architecture, Technical Architecture
Participants see to non-functional requirements aspects of the solution.
- Specific Roles:
Sponsor (Product Owner), Team Lead (Architect), ScrumMaster, Developer, DBA, UI/UX Designer, Graphic Artist, Tester, Business Analyst, Specialists in Security/Deployment/Documentation
Participants see to functional requirements aspects of the solution.
- Anything Else You Can Make Up! What have you seen?
Limited View of Engagement Process
Every participant — especially BAs — might not be participating in every phase of an effort, and so may miss out on some background and some follow-through.
Different Solution Concepts
Types of Solutions
- IT: web, microservices, distributed, client-server, HPC, desktop, mobile, embedded, IOT
- Physical Process: retail, manufacturing, service, transportation, utility, hospitality, medical
- Information: financial, media, research, education/training, communications, entertainment
- Hybrid: combinations of above
- Process vs. Product: characteristics of doing something or characteristics of being something (especially for physical items)
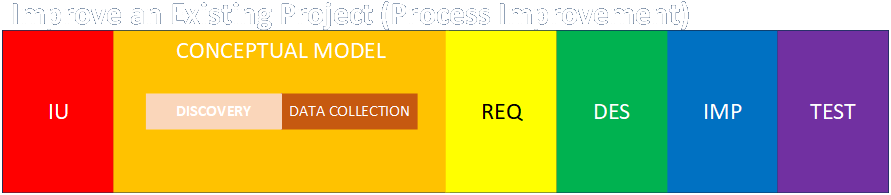
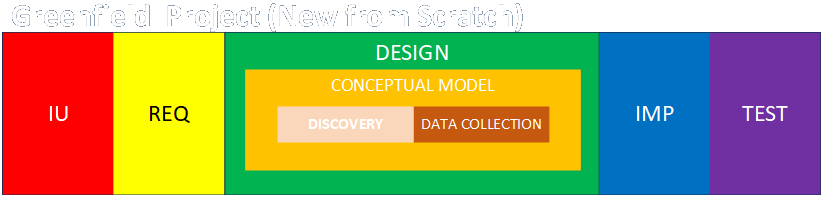
- Creation/Greenfield vs. Improvement: improvement encompasses rearrangement, substitution, compression, and automation
- Scope and Scale of Problem: may vary widely from very small and limited to very large and far-reaching
Different Engagement Concepts

|
|
Link to detailed discussion.
Different Engagement Concepts (continued)
|
|
Link to detailed discussion.
Different BA 50 Techniques (from the BABOK)
|
|
|
Link to detailed discussion.
Different Software Tools (from surveys)
| 24 | Excel | Both |
| 14 | Jira | Engagement |
| 14 | Visio | Solution |
| 13 | Word | Both |
| 8 | Confluence | Both |
| 7 | Outlook | Engagement |
| 6 | SharePoint | Engagement |
| 5 | Azure DevOps | Solution |
| 4 | Team Foundation Server | Engagement |
| 4 | PowerPoint | Engagement |
| 3 | Engagement | |
| 3 | Google Docs | Engagement |
| 2 | MS Dynamics | Engagement |
| 2 | Visual Studio | Solution |
| 2 | Notepad | Both |
| 2 | OneNote | Engagement |
| 2 | SQL Server | Solution |
Software greatly aids sharing and communications, so BAs will concentrate on this. However, a huge amount of solutioning will be aided by specific, technical software or will be software, with which BAs will tend to be less involved.
Link to detailed discussion. Link to survey results.
What To Do? Questions and Razors
Are there champions for the effort?
- What are they like and what do they want?
- How much and how well do they inform their people?
- How much do they empower their people?
How much is the effort empowered to look at or change?
- Who has it been arranged to talk to?
- Can you talk to people or research independently? (It's not always bad if you can't; people's time is valuable.)
- Are there any areas you aren't allowed to investigate or technologies or solutions you aren't allowed to discuss?
- Do you know the scope and scale of the effort, and its boundaries and limitations?
- Will managers and other stakeholders change based on your findings and feedback?
What To Do? Questions and Razors continued
How much do you know as a BA?
- ...about the business, industry, technical tools, other job functions, competitors, data, BA practice, etc.
- How comfortable are you in talking to people, taking initiative, and recommending change?
- How persistent are you in obtaining (demanding!) clarification and iterative review?
- How flexible and adaptive are you?
How much do other practitioners know?
- Are there iterative cycles of review and feedback to ensure everything is covered and people know what they need to know?
- Are there internal or external communities of practice that can be started or leveraged? (Some of this will depend on the size of the organization.)
- Do people need training? Is it available? Is it effective? Do people want it?
What To Do? Questions and Razors continued
Is the effort focused on incremental changes, quantum leaps, or something in between?
- Is the scope and scale well defined, and do all the practitioners and stakeholders know what is intended?
- Does everyone know what the goal is?
What inspired the effort?
- Strengths: leveraging or improving existing capabilities
- Weaknesses: general unease or specific problems and issues? (There's never enough time to do it right but there's always enough time to do it over...)
- Opportunities: take advantage of new technologies, methods, gaps, market niches, or competitor missteps
- Threats: external competitive or regulatory threats
- These points of view make up a SWOT analysis.
- New people may want to shake things up.
What To Do? Questions and Razors continued
Profiling current activities or products
- Find out where most of the costs or resources are going, and try to address those first.
- Could be related to speed, time, money, materials, personnel, memory/storage usage, etc.
Does everyone have a clear picture of what's going on now? Does anyone?
- Get guided tours by experts and consult existing documentation (drawings, data, manuals) if available.
- If not, then nothing beats finding out what's going on...
- ...so let's talk about process mapping!
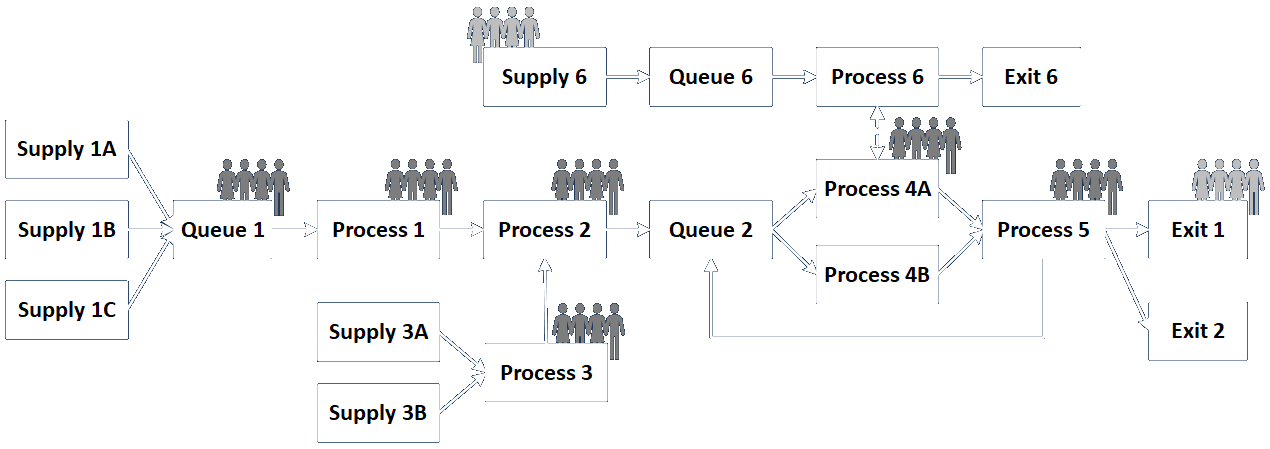
Process Mapping
- Describes what comes in, where it goes, how it's transformed, and what comes out.
- Describes the movement and storage of information, material, people, and other entities.
- Maps define the scope of a process. Links to connected processes or "everything else" are called interfaces.
- Are presented at the level of detail that makes sense.
- Process elements within maps can themselves be processes with their own maps.
- State, timing, and other data can be included.
- Entities in a process can be split and combined.
- Processes and entities may be continuous or discrete.
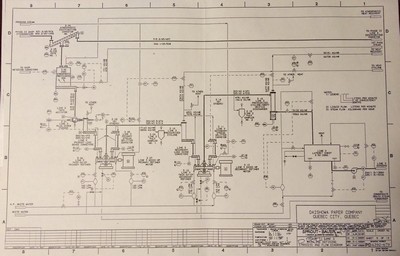
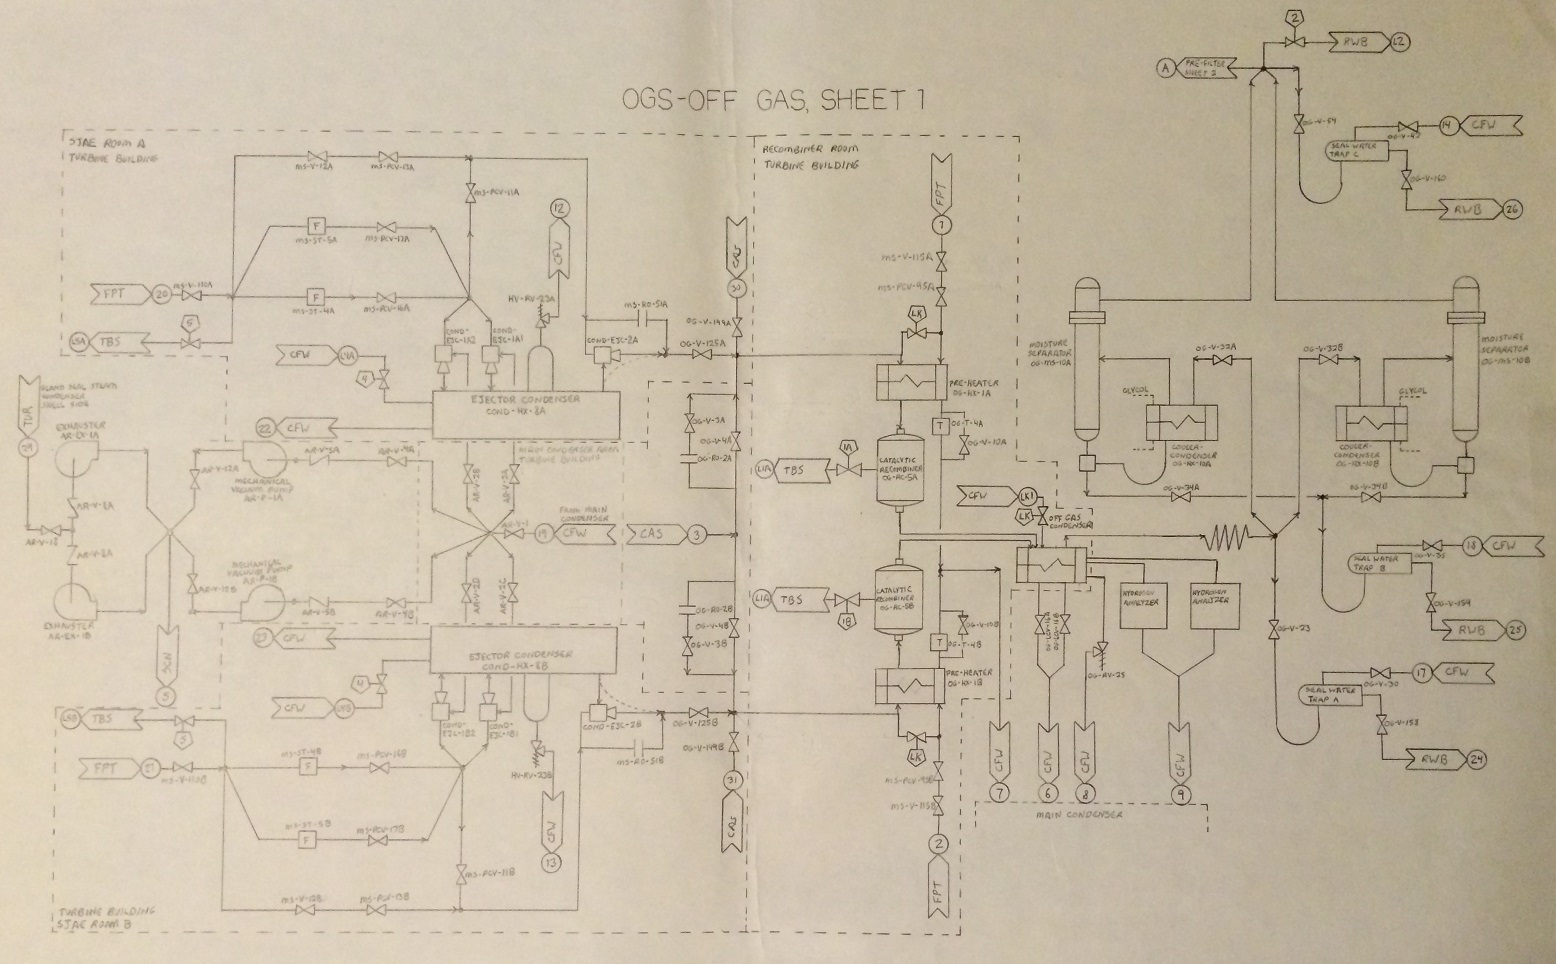
Process Mapping (continued)
Processes may be mapped differently based on needs, industry standards, and the information to be represented.
|
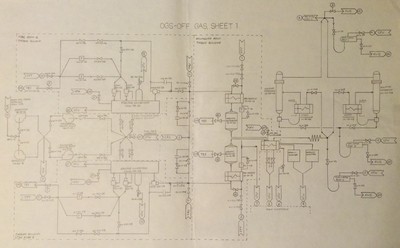
|
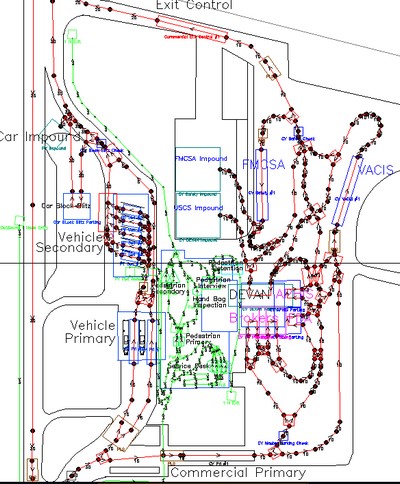
|
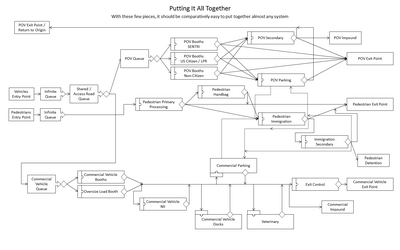
|
Mechanical Pulping Mill, Quebec City, QC
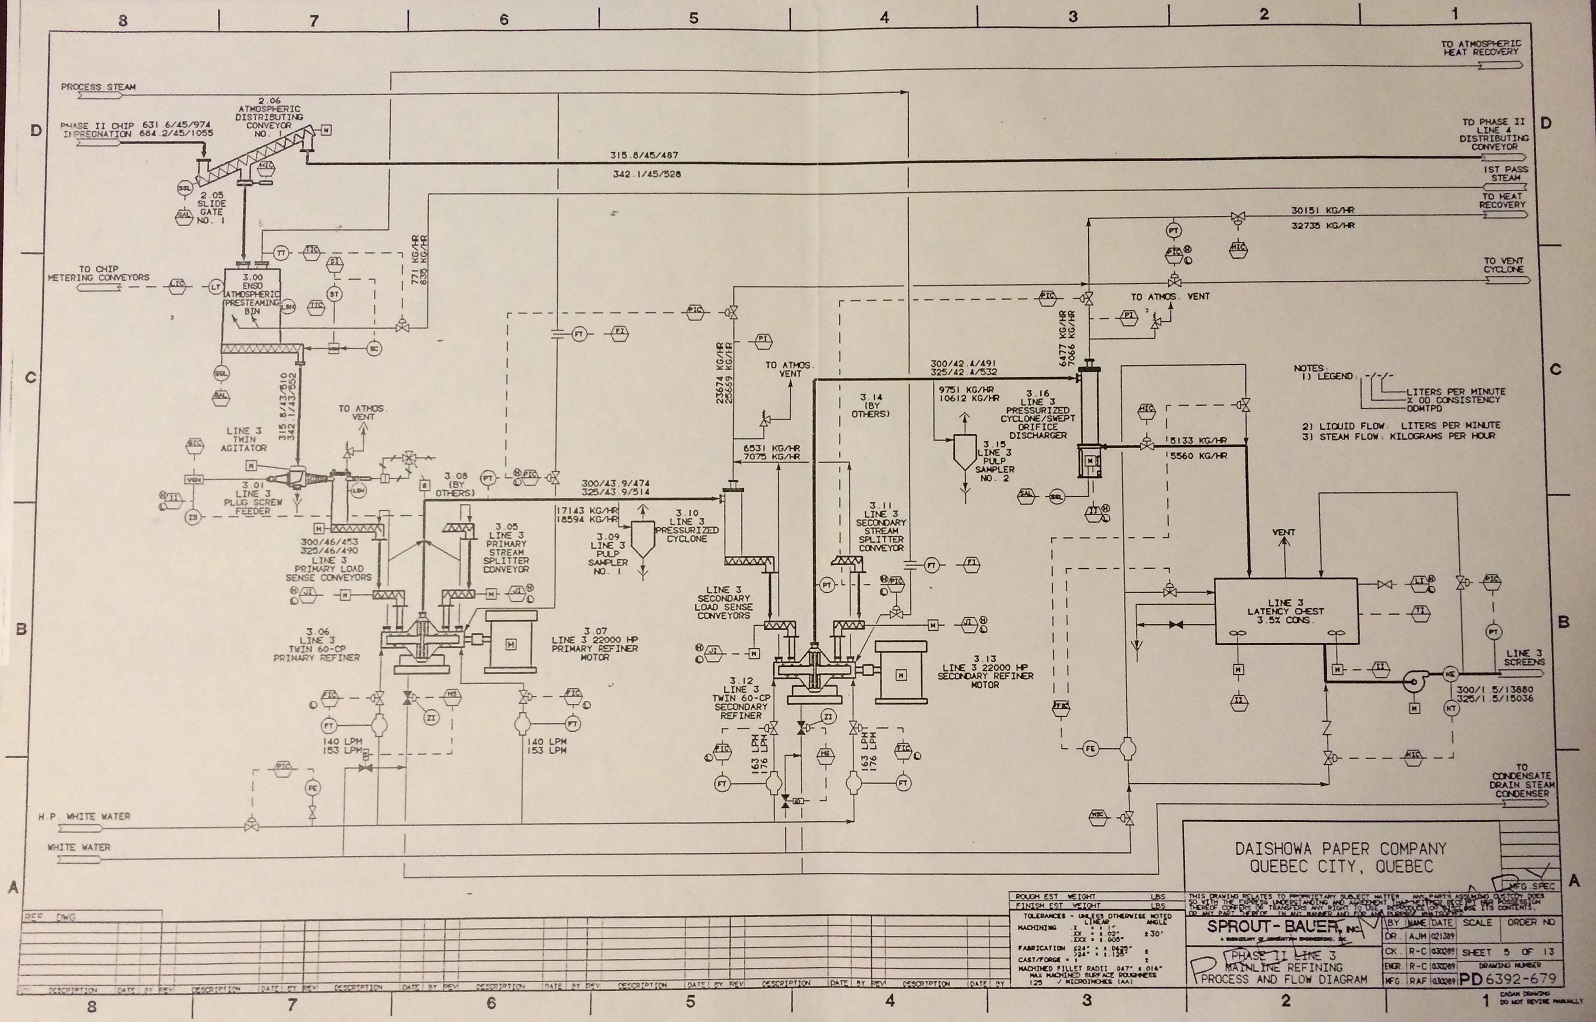
Offgas System in BWR Nuclear Power Plant, Richland, WA
Land Border Port of Entry, Columbus, NM
Architecture Study: General Purpose Discrete-Event Simulation

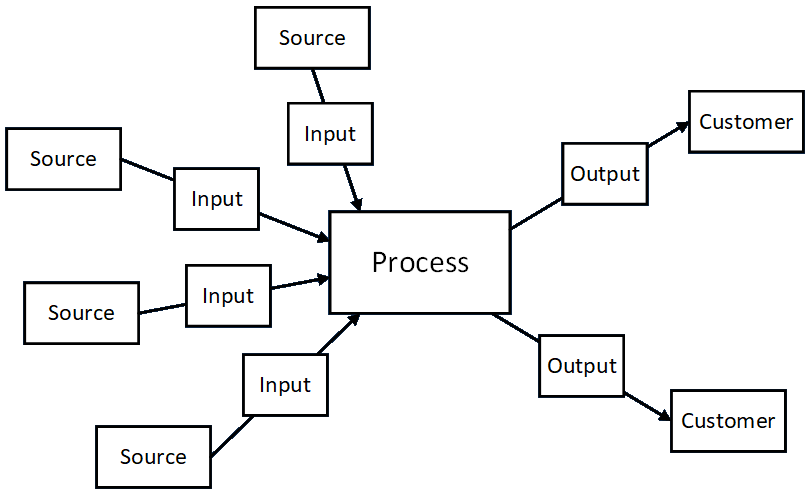
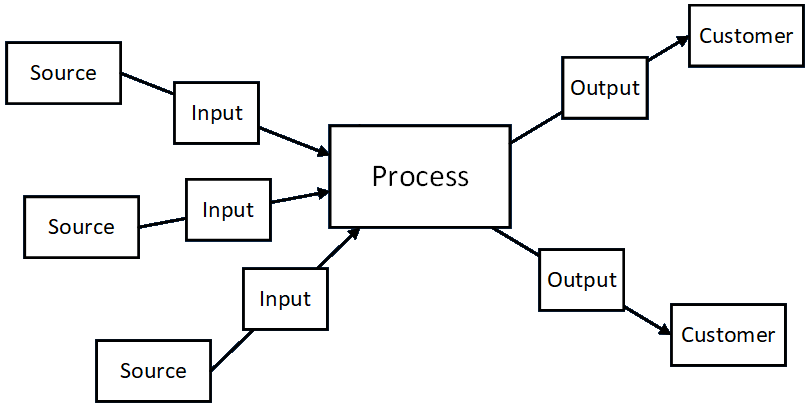
Process Mapping (continued)
- S-I-P-O-C vs. C-O-P-I-S
- Any number of inputs and outputs are possible.
Process Mapping (continued)
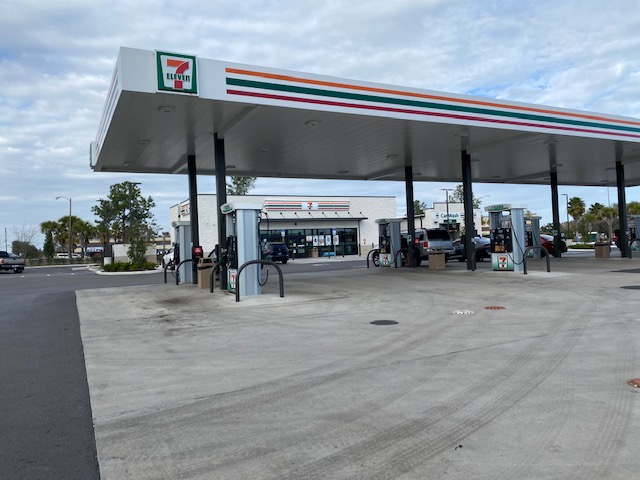
Process Mapping (continued)

Process Mapping (continued)
|
|
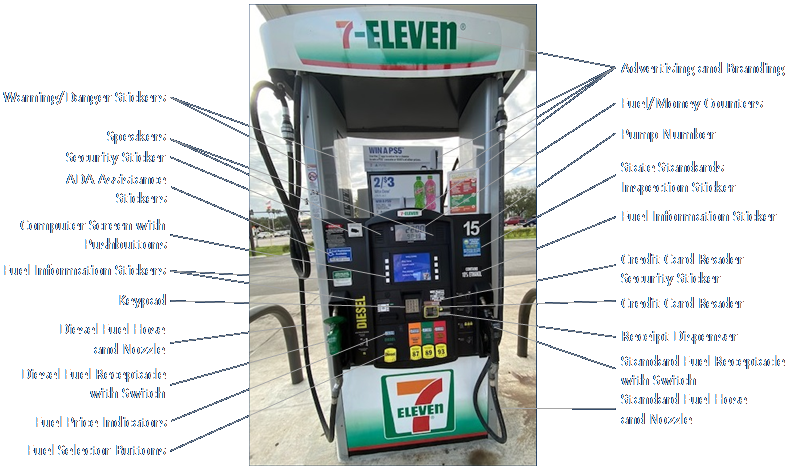
Process Mapping (continued)
I give specific names to modular components.
Link to detailed discussion.
Process Mapping (continued)
- Operations inside a process block can be examined to any depth.
- The level of detail should be appropriate to the problem.
Process Mapping (continued)
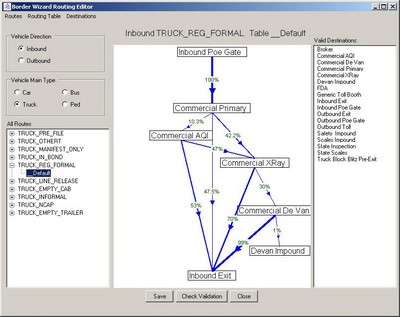
- Procedures and state transitions can be represented in any way that makes sense.
- Procedures will sometimes be random from definable results and percentages.
- Can consider the emotional or customer satisfaction level in a Customer Journey Map as part of Service Design.
Making Sure The Analysis Is Thorough

- Consider all elements from all angles.
- UML is a formal example. The BABOK is more diffuse.
- Simulation is great for understanding because the results show if everything's included.
- Formal mathematical proofs of correctness and optimality exist for some problems.
- Customer review and realized results are the best proof for most BA engagements.
Discovery vs. Data Collection
Discovery is a qualitative process. It identifies nouns (things) and verbs (actions, transformations, decisions, calculations).
Data Collection is a quantitative process. It identifies adjectives (colors, dimensions, rates, times, volumes, capacities, materials, properties).
Discovery comes first, so you know what data you need to collect.
Imagine you're going to simulate or automate the process. What values do you need? This is the information the implementation teams will need.
Context of Discovery
Elicitation is discovering the customer's needs. Discovery is about mapping the customer's existing process.
If there is no existing process, i.e., a new (greenfield) process is being built from scratch, then a form of discovery will occur during Requirements and Design.
Link to detailed discussion.
Data Collection (Process Characterization)
- Captures qualitative descriptions of entity types and characteristics, process types and characteristics, and decisions made.
- Captures quantitative data:
- physical dimensions, volumes, and storage capacities
- arrival and departure rates and times
- diversion percentages (what parts of outputs go where)
- process durations
- whatever is needed to describe transitions
- counts or quantities of what's stored
- velocities, frequencies, and fluxes
- number of stations in each sub-process
Link to detailed discussion.
Data Collection (Process Characterization) (continued)
- Walkthroughs: guided and unguided (Waste Walk)
- Drawings, Documents, Manuals, Specifications
- Electronic Collection (real-time vs. historical, integrated vs. external sensors)
- Visual / In-Person (notes, logsheets, checklists, mobile apps)
- Interviews (with SMEs)
- Surveys
- Video
- Photos
- Calculations
- Documented Procedures and Policies
Data collection corresponds to the Observation technique in the BABOK. Methods include:
Domain Knowledge Acquisition
- BAs should learning machines (and also communication and translation machines)
- Domain knowledge is acquired from prior experience or training or from the process SMEs as you go.
- What you need to know to:
- capture process details
- analyze the operations
- perform calculations
- make sure you don't miss anything
Link to detailed discussion.
IVV&A Inspiration for the Framework
Tell 'em what you're gonna do. Do it. Tell 'em what you did.
| Accreditation Plan | V&V Plan | V&V Report | Accreditation Report |
| Executive Summary | Executive Summary | Executive Summary | Executive Summary |
| 1. Problem Statement | 1. Problem Statement | 1. Problem Statement | 1. Problem Statement |
| 2. M&S Requirements and Acceptability Criteria | 2. M&S Requirements and Acceptability Criteria | 2. M&S Requirements and Acceptability Criteria | 2. M&S Requirements and Acceptability Criteria |
| 3. M&S Assumptions, Capabilities, Limitations, and Risks & Impacts | 3. M&S Assumptions, Capabilities, Limitations, and Risks & Impacts | 3. M&S Assumptions, Capabilities, Limitations, and Risks & Impacts | 3. M&S Assumptions, Capabilities, Limitations, and Risks & Impacts |
| 4. Accreditation Methodology | 4. V&V Methodology | 4. V&V Task Analysis | 4. Accreditation Assessment |
| 5. Accreditation Issues | 5. V&V Issues | 5. V&V Recommendations | 5. Accreditation Recommendations |
| 6. Key Participants | 6. Key Participants | 6. Key Participants | 6. Key Participants |
| 7. Planned Accreditation Resources | 7. Planned V&V Resources | 7. Actual V&V Resources Expended | 7. Actual Accreditation Resources Expended |
| 8. V&V Lessons Learned | 8. Accreditation Lessons Learned | ||
| Suggested Appendices | Suggested Appendices | Suggested Appendices | Suggested Appendices |
| A. M&S Description | A. M&S Description | A. M&S Description | A. M&S Description |
| B. M&S Requirements Traceability Matrix | B. M&S Requirements Traceability Matrix | B. M&S Requirements Traceability Matrix | B. M&S Requirements Traceability Matrix |
| C. Basis of Comparison | C. Basis of Comparison | C. Basis of Comparison | C. Basis of Comparison |
| D. References | D. References | D. References | D. References |
| E. Acronyms | E. Acronyms | E. Acronyms | E. Acronyms |
| F. Glossary | F. Glossary | F. Glossary | F. Glossary |
| G. Accreditation Programmatics | G. V&V Programmatics | G. V&V Programmatics | G. Accreditation Programmatics |
| H. Distribution List | H. Distribution List | H. Distribution List | H. Distribution List |
| I. Accreditation Plan | I. V&V Plan | I. Accreditation Plan | |
| J. Test Information | J. V&V Report |
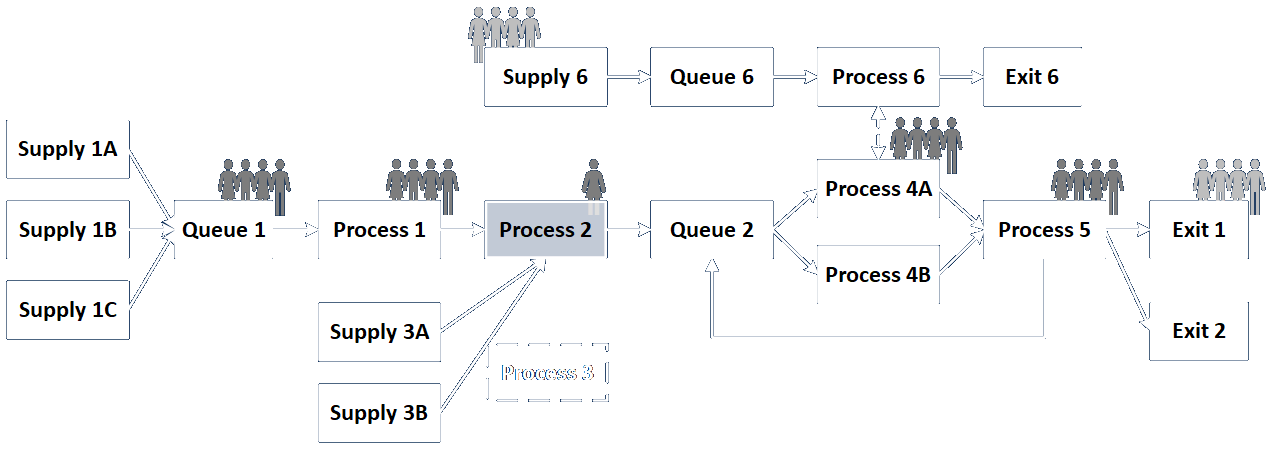
Process Improvement
- Incremental improvement vs. Quantum Leap (The Big Kill!)
- Center to target and reduce variation (Six Sigma)
- Rearrangement and Compression (Lean)
- Substitution / Elimination / Automation
- Modify a sub-process and see how it affects the whole system
- Theory of Constraints: The Five Focusing Steps:
- Identify the constraint
- Exploit the constraint
- Subordinate to the constraint
- Elevate the constraint
- If constraint is "broken" go back to step 1
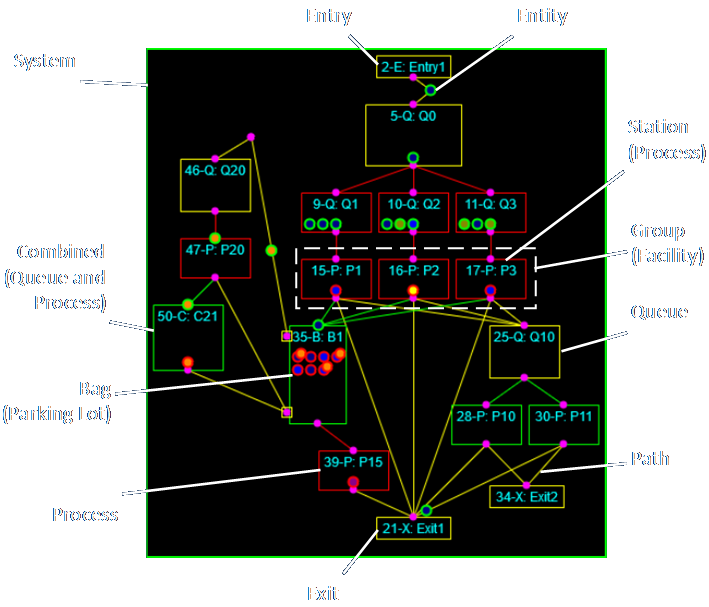
Example Simulation
Simple pass-through simulation using basic component types.
Monte Carlo Analysis "It was smooth sailing!" vs. "I hit every stinkin' red light today!"
Involves running multiple trials of complex models including combinations of numerous randomly generated outcomes that yield a range of complex results.
Models may incorporate scheduled and unscheduled elements.
- Randomly generated outcomes may include:
- event durations
- process outcomes
- routing choice
- event occurrence (e.g., failure, arrival; Poisson function)
- arrival characteristic (anything that affects outcomes)
- resource availability
- environmental conditions
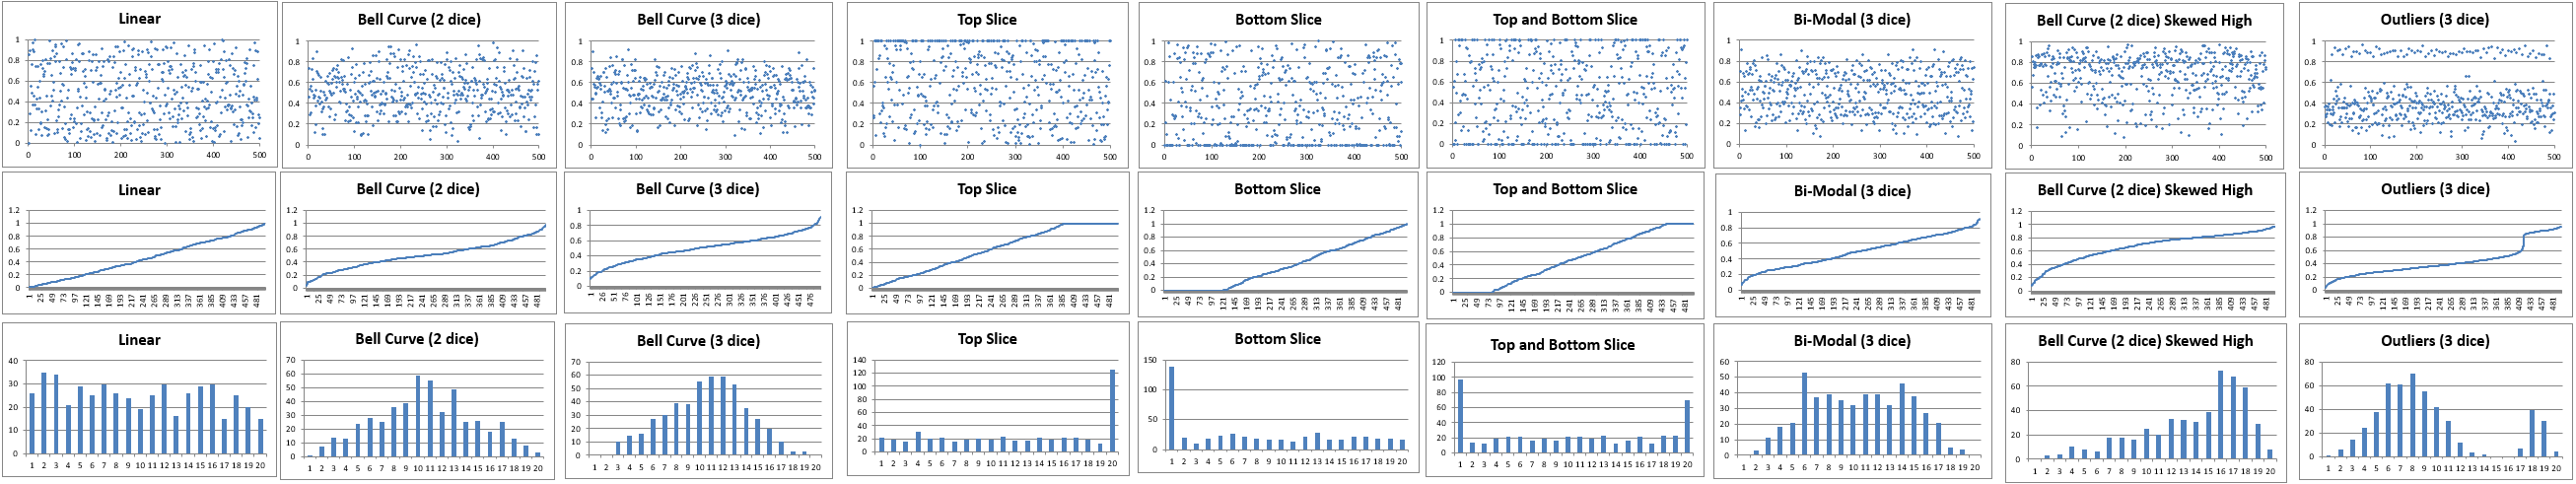
- Random values may be obtained by applying methods singly and in combination, which can result in symmetrical or asymmetrical results:
- single- and multi-dice combinations
- range-defined buckets
- piecewise linear curve fits
- statistical and empirical functions
- rule-based conditioning of results
Link to detailed discussion.
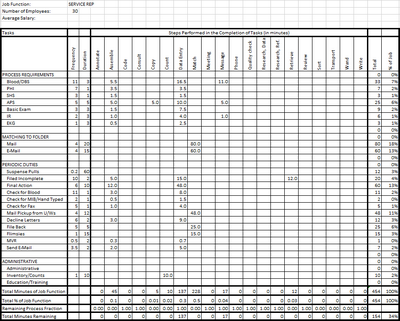
Examples of Data Driving Random Outcomes
Organizations Exist To Provide Value!
Every activity in an organization must provide value directly or indirectly.
Every object in an organization must provide value directly or indirectly.
Business analysts are a contemporary embodiment of the problem-solving, value-creating aspects of organizations, but there's a lot of overlap with other roles.
Tomorrow the role may be called something different. The Wikipedia page for seemingly every management idea has a section for criticisms.
There Are No Silver Bullets Or Final Answers
Facts and Fallacies of Software Engineering describes 50 years of incremental advance.
This presentation and other information can be found at my website:
E-mail: bob@rpchurchill.com
LinkedIn: linkedin.com/in/robertpchurchill